Lessons in Benchmarking: Aiera’s Earnings Call Summaries

Evaluating large language models (LLMs) on generative tasks can be complicated…
As an example, different phrases can have equivalent meaning:
- The cat jumped onto the windowsill.
- The feline leaped onto the window ledge.
And evaluating the performance of large language models (LLMs) on summarization tasks can be particularly challenging:
- Quality is subjective. Summarization often involves subjective judgments about what makes a “good” summary.
- Language is complex. Human languages are full of context-sensitive expressions.
- There is no single ‘correct’ answer: There can be many correct ways to summarize the same content, varying in structure, length, and detail.
- Inadequate evaluation metrics: Standard evaluation metrics that measure similarity to reference summaries (ROUGE and BLEU) may not adequately capture the quality of alternative, yet equally valid, summaries.
At Aiera, we generate summaries for all transcribed events. Naturally, we’ve run into some issues evaluating how well our summaries are performing at scale. Our domain favors terse, quantitative expressions and specific financial metrics over high-level text summaries. We developed a benchmark to evaluate how well our summaries were performing.
Our first step was assembling a dataset of high-quality summaries based on earnings call events. Using a small 38-call sample of Aiera’s event transcriptions, we used claude-3-opus-20240229 (best performance at time of writing on language reasoning tasks) to extract targeted information from each event. Our extraction prompt template is below:
Event Transcript: {{event transcript}}


Analyze the above event transcript and generate a report of outcomes. Organize
your reports into the following categories, providing answers to the bulleted
questions if available.
1. Financial Performance:
* What were the reported revenue and earnings compared to the previous
quarter and the same quarter last year?
* Were there any significant changes in profit margins?
* How did the financial results compare to analysts' expectations?
2. Operational Highlights:
* What were the key operational achievements during the period?
* Were there any new product launches, acquisitions, or partnerships announced?
* How did supply chain, production, or service delivery issues impact the
business?
3. Guidance and Projections:
* What guidance did the company provide for the next quarter and the full year?
* Did the company revise any of its financial forecasts? If so, why?
* What factors are expected to drive or hinder future performance?
4. Strategic Initiatives:
* What strategic initiatives are underway, and how are they expected to
impact the company's future?
* How is the company investing in innovation or technology?
* What are the long-term goals discussed by the management?
* Market and Competitive Landscape:
* How is the company positioned within the industry compared to its
competitors?
* Were there any discussions about market trends or economic conditions
affecting the industry?
* How is the company responding to competitive pressures?
5. Risks and Challenges:
* What risks and challenges did the management highlight?
* How is the company planning to mitigate these risks?
* Were there any regulatory or geopolitical impacts mentioned?
6. Management Commentary:
* What were the key takeaways from the CEO's and CFO's remarks?
* Were there notable quotes or statements that reflect the company's
confidence or concerns?
* How transparent was the management in discussing challenges and setbacks?
We compared these results to public commentary to identify significant points, missing context, and assembled coherent paragraphs from the highest importance items. We then performed both llm-based and manual verification of the summary metrics. Our dataset is available on huggingface here.
Now, we defined our generation prompt. Prompting allows us to tailor our summaries to the information we feel is important. We prompted gpt-4-turbo-2024-04-09 to generate a replication prompt using a transcript and the curated summary as an attempt to distill the summary ethos from the largely manual curation. Use of gpt-4-turbo-2024-04-09 was intentional in this case to introduce another model’s “take” on the reference summaries rather than relying solely on claude-3-opus-20240229. This approach introduced some issues that we’ll cover later in this article.
Event transcipt: {{transcript}}

Provide a technical summary of the event transcript in a concise paragraph,
highlighting significant announcements, financial results, and strategic
plans discussed by key speakers. Focus on the major outcomes, operational
achievements, and  future guidance provided during the event. Include
important metrics, major deals or partnerships, and any technological
advancements or integrations mentioned. Also, note any specific challenges
or issues addressed during the event. Conclude with the overall sentiment
expressed by the leadership or key speakers regarding the organization's
future direction and growth prospects.
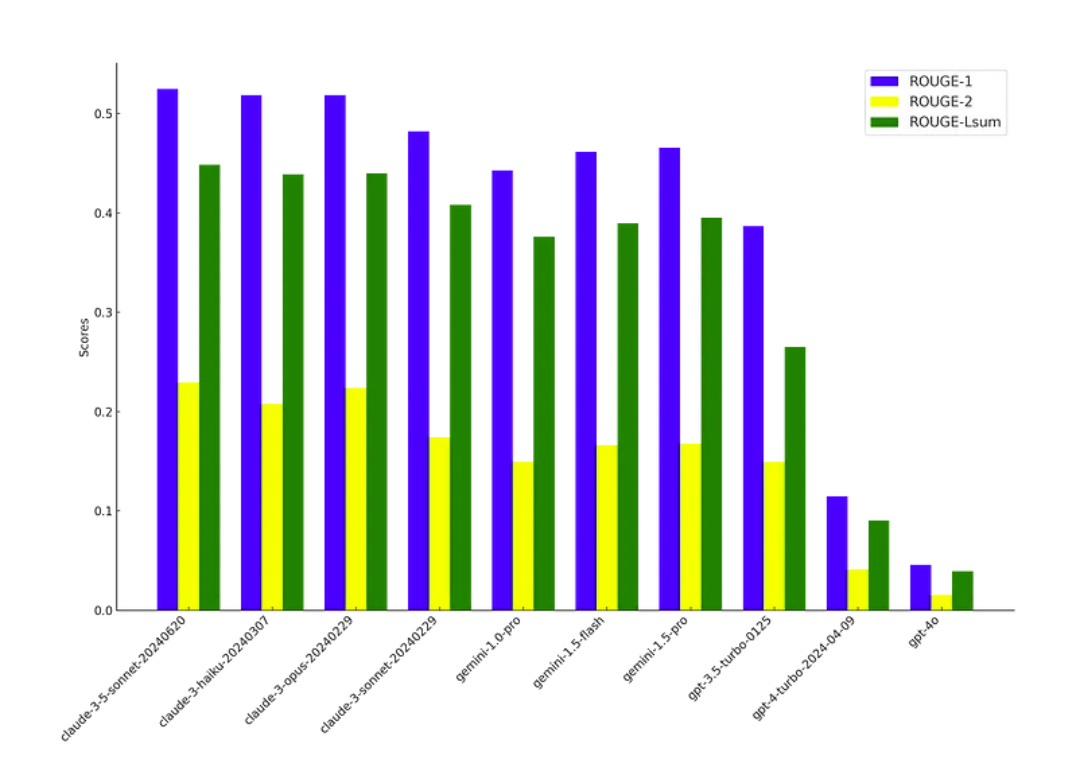
Using a matrix of models, we used this prompt to generate summaries of the transcripts in our dataset. We used ROUGE scores to compare generated summaries to the dataset reference summaries, measuring the overlap in terms of n-grams, word sequences, and word pairs. These scores typically range from 0 to 1, where 0 indicates no overlap and 1 signifies a perfect match between the generated summary and the reference.

Our results suggest some correlation between performance and provider, with all Anthropic models significantly beating OpenAI. This immediately indicates an issue.
Why do OpenAI’s models perform so poorly in comparison to their peers?
Our initial extraction bullets were generated with claude-3-opus-20240229 and because Anthropic likely uses similar training data on each model, its reasonable that all Anthropic models use a similar vocabulary and therefore favor certain combinations of words. Our ROUGE scoring method unfairly penalizes the other providers whose models may have different vocabularies, even they may report the same information. Central to this issue is that the ROUGE scores look for exact-matches in ordered words, penalizing reorderings of words and discounting synonyms.
One alternative to ROUGE is BERT-scoring. BERT-scoring calculates the similarities of text embeddings rather than the text itself. Text embeddings are numerical representations of text where each word or phrase is mapped to a vector of real numbers. These embeddings are designed so that words with similar meanings are positioned closely together in this space, effectively encoding semantic meaning into geometric relationships. The process leverages machine learning techniques to learn these embeddings from large corpora of text, capturing nuanced relationships such as synonyms, antonyms, and contextual usage. This spatial coding of text enables algorithms to perform various natural language processing tasks more effectively, such as sentiment analysis, machine translation, and topic modeling, by understanding the underlying semantic properties of the text. BERT-scoring uses a pre-trained BERT model (in our case we used Google’s https://huggingface.co/google-bert/bert-base-uncased).
I won’t get into the full calc here, the original paper posted is a great reference:
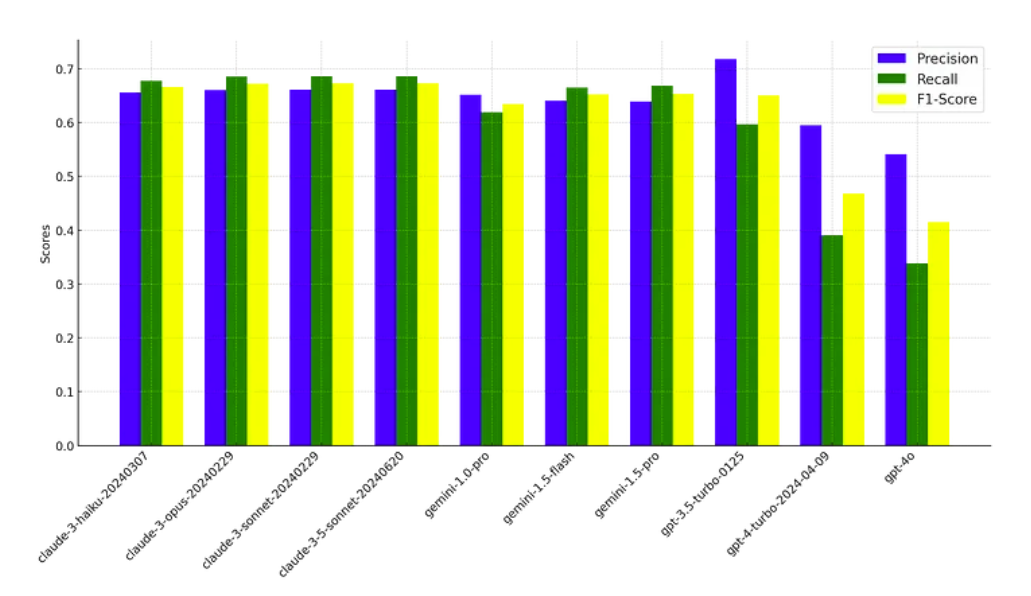
Using the BERT embeddings, we can calculate either precision, recall, or the f1 score. Precision measures the proportion of instances where the model correctly identifies similar or relevant texts, emphasizing the avoidance of incorrectly matched texts. Recall evaluates how well the model captures all relevant instances of similarity, while the F1 score harmonizes precision and recall, providing a single metric to gauge the model’s overall performance in identifying text relationships accurately. Like the ROUGE scores, these values range from 0–1 with 1 signifying a perfect match.
Let’s compare rouge and BERT scores for our original example:
- The cat jumped onto the windowsill.
- The feline leaped onto the window ledge.
from bert_score import BERTScorer
from transformers import BertTokenizer, BertForMaskedLM, BertModel

def bert_score(ref, pred):
    # BERTScore calculation
    scorer = BERTScorer(model_type='bert-base-uncased')
    P, R, F1 = scorer.score([pred], [ref])
    return P, R, F1

def rouge(ref, pred):
    rouge_types = ["rouge1", "rouge2", "rougeLsum"]
    scorer = rouge_scorer.RougeScorer(rouge_types)

    # Add newlines between sentences to correctly compute `rougeLsum`.
    pred = pred.replace(" . ", ".\n")
    ref = ref.replace(" . ", ".\n")

    # Accumulate confidence intervals.
    return scorer.score(ref, pred)

BERT and Rouge scores for the cat jumping example
We can see that the BERT scoring method offers stronger indication of sentences similarity. Now, we calculate BERT scores for all models across our dataset.

Immediately, we observe a massive narrowing of the performance gap. gpt-3.5-turbo-0125 even outperforms the Anthropic models on the precision metric. Interestingly, Anthropic and Google’s models perform similarly with other models developed within their organization. OpenAI’s models on the other hand, show unexpected grading, with gpt-3.5-turbo-0125 noticeably outperforming the gpt-4 model class.
Unfortunately, our results do not explicitly indicate which model is best at financial summarization. Our results are inevitably confounded by not only our choice of claude-3-opus-20240209 in the assembly of the dataset, but by:
- Stylistic Differences: Anthropic’s style may differ significantly from the styles BERT was exposed to during training. This can include narrative style, sentence structure, and vocabulary usage. Such stylistic differences might lead BERT to undervalue otherwise semantically accurate summaries because they don’t align with the learned patterns.
- Sensitivity to Contextual Nuances and Training Vocabulary: While BERT excels at understanding contextual nuances within the range of its training data, its ability to interpret subtleties in new contexts or underrepresented data in its training set might be limited. This can result in less reliable scores for summaries that involve subtle meanings or complex inference. Our next step will be repeat this scoring process using domain-specific encodings.
- Inherent Model Bias: All models, including BERT, come with inherent biases inherited from training data. These biases might affect how the model scores certain phrases or ideas, potentially leading to inconsistent scoring across different types of summaries.
- Prompting Bias: Our summarization prompt may not necessarily represent our target. Using an example to derive the reference summary introduced model-specific and stylized bias, reducing the generalizability of the summarization across different events and models.
Even so, we’re still earned some insight. Performance flatness across Anthropic and Google models may inform budgeting decisions, given significant spreads in model pricing. Our results also challenged the assumed superiority of models reporting SOTA performance like gpt-4-turbo-2024-04-09 over its predecessors. In addition to pre-generation benchmarking and iteration, Aiera uses human verification to reduce hallucination and evaluate prompt performance. In concert, benchmarking and human verification allow Aiera to continually adapt to the always-changing model landscape and meet the standards for delivery within the financial industry.
You can replicate our results using the EleutherAI’s lm-evaluation-harness using the instructions in our github repo here.
